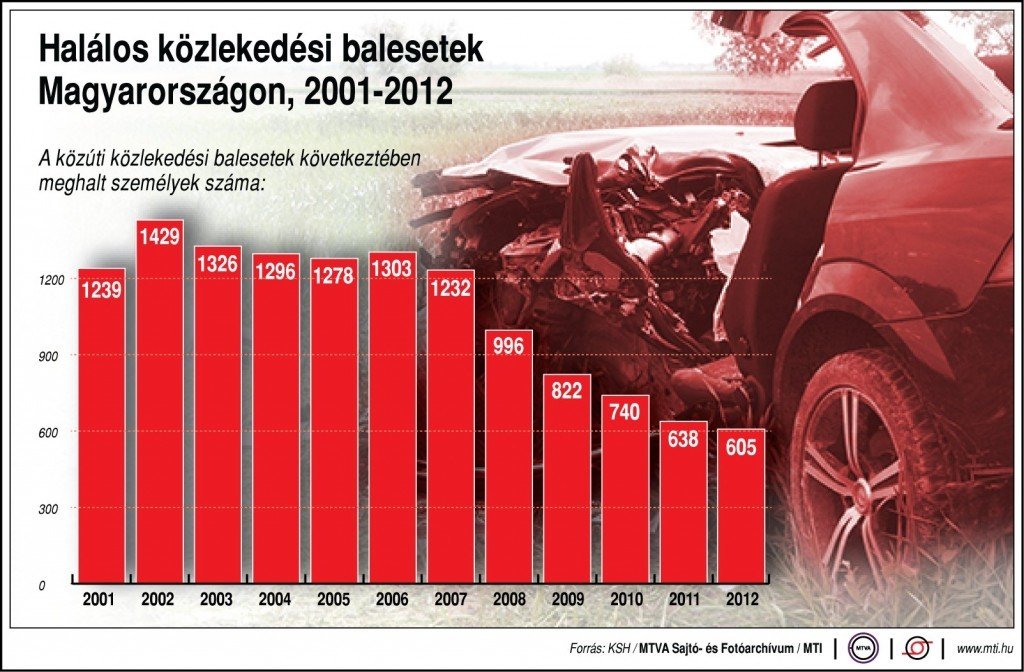
On the graph: The number of people died in road accidents in Hungary (2001-2012).
The graph clearly shows that the number of fatalities decreased by half in Hungary between 2001 and 2012.

Photo: MTI – Donka Ferenc
Graph: MTI – Havaria
Source: http://mti.hu/